Code
from report_utils import plot_elo_landscape

fig = plot_elo_landscape()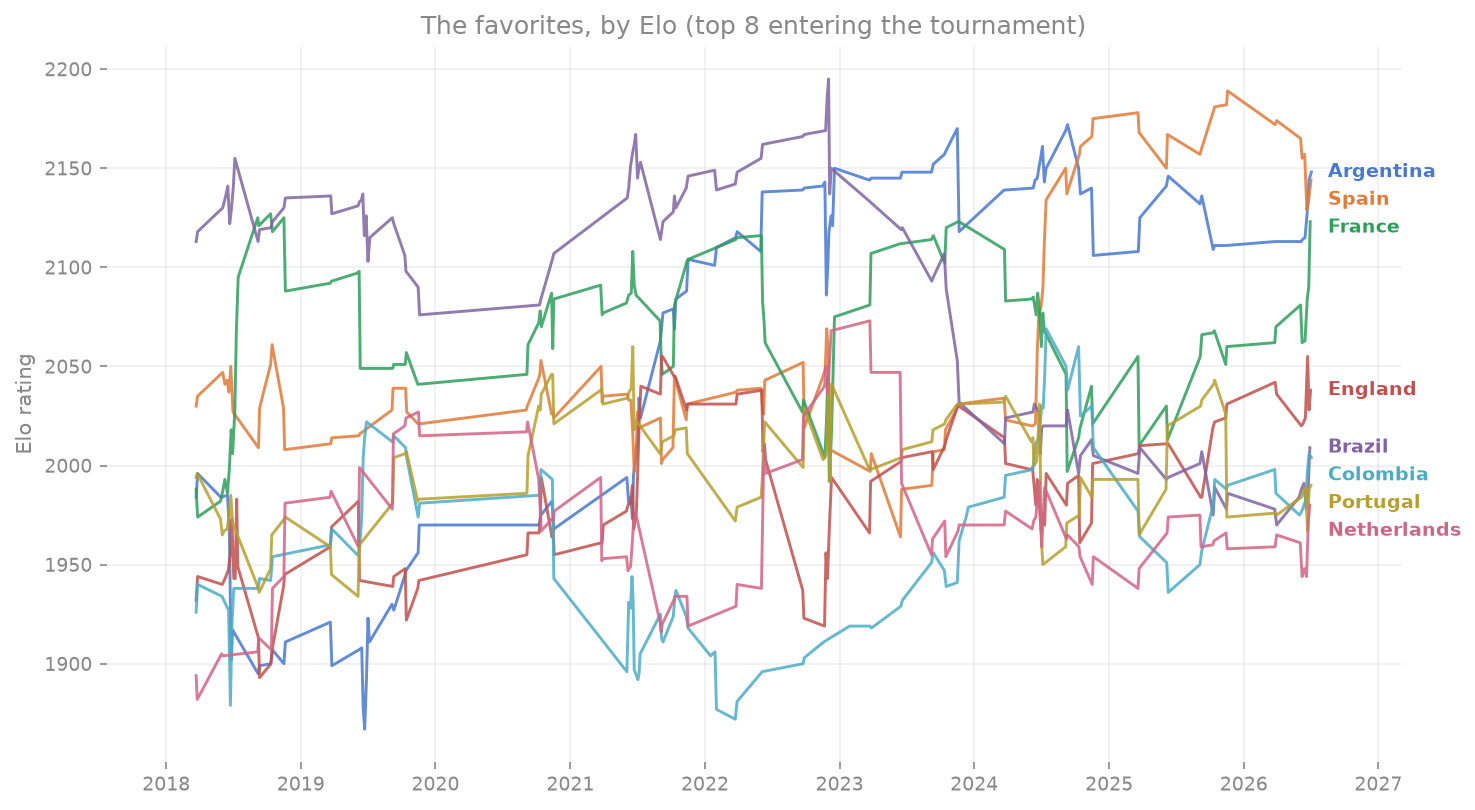
A live experiment: predicting every round of the tournament, in public, as it happens
Most prediction projects are published after the fact, when it is easy to look smart. This one runs the other way around: before each round of the 2026 World Cup, the model publishes its predictions, and after the round we score them against reality — no retroactive edits, no cherry-picking.
Status: tournament in progress. Group stage and Round of 32 are complete and scored. The Round of 16 is being played right now, and this page updates after every round until the final on July 19.
The scoreboard and the bracket below are generated straight from the prediction files and the match results, so what you see is exactly what the model committed to.
Elo ratings are the obvious starting point for international football: a single number per team, updated after every match. But predicting a winner by comparing two Elo numbers has a built-in flaw: it always picks the higher-rated team. It can never see an upset coming, it says nothing about the score, and it treats a 5-goal thrashing and a penalty-shootout escape as the same outcome.
The Elo rating is a snapshot of how strong a team is today. What it does not capture is behavior: how many goals a team tends to score against opposition of a given strength, in a given place, in a given kind of match. That behavior is what this project models.
Instead of one global model, we train a separate Poisson regression for every national team, on that team’s own match history. The target is the number of goals the team scores in a match, and the features are:
To predict a match, we ask each team’s model the same question: how many goals would you score against this opponent, here, in a World Cup match? The two answers give a predicted score, and the higher answer picks the winner.
Training on each team’s own history also preserves identity. Playing Brazil has a weight of its own that a rating number does not fully capture, and a per-team model keeps those matchup dynamics in the data it learns from.
Team-level history says nothing about who is actually on the pitch. So a second workflow adds a player layer: using individual player Elo ratings, we compare the average of a team’s four best attackers against the opponent’s defensive block (four best defenders, best midfielder and best goalkeeper). That attack-versus-defense ratio, raised to a damping exponent tuned on the completed rounds ((atk/def) ** 2.5 - the experiment lives on the model vs reality page), scales the predicted goals up or down.
Both workflows predict the same fixtures from the same data, which turns the tournament into a controlled comparison: naive (team history only) versus ensemble (team history plus players). Whether the player layer actually earns its keep is tracked on the model vs reality page.
Before any modeling, the ratings themselves sketch the landscape: the eight strongest teams entering the tournament, and how they got here since the 2018 cycle.
from report_utils import plot_elo_landscape
fig = plot_elo_landscape()
Winner accuracy and mean absolute goal error per round, for both workflows, over every match played so far. A real draw always counts as a miss: a Poisson model practically never predicts identical expected goals for both sides.
from report_utils import scoreboard

scoreboard()| round | matches | naive_accuracy | naive_goal_mae | ensemble_accuracy | ensemble_goal_mae | |
|---|---|---|---|---|---|---|
| 0 | Group stage - Matchday 1 | 24 | 0.500 | 2.15 | 0.542 | 2.59 |
| 1 | Group stage - Matchday 2 | 24 | 0.458 | 1.62 | 0.625 | 1.75 |
| 2 | Group stage - Matchday 3 | 24 | 0.458 | 1.83 | 0.542 | 1.86 |
| 3 | Round of 32 | 16 | 0.625 | 1.51 | 0.688 | 1.68 |
The knockout stage, as the model called it and as it actually happened. Bold marks the model’s pick: green when the pick advanced, red when it was eliminated. Green shading follows the team that actually went through, and dashed slots are rounds not yet drawn.
from report_utils import plot_bracket

fig = plot_bracket(prefix="ensemble")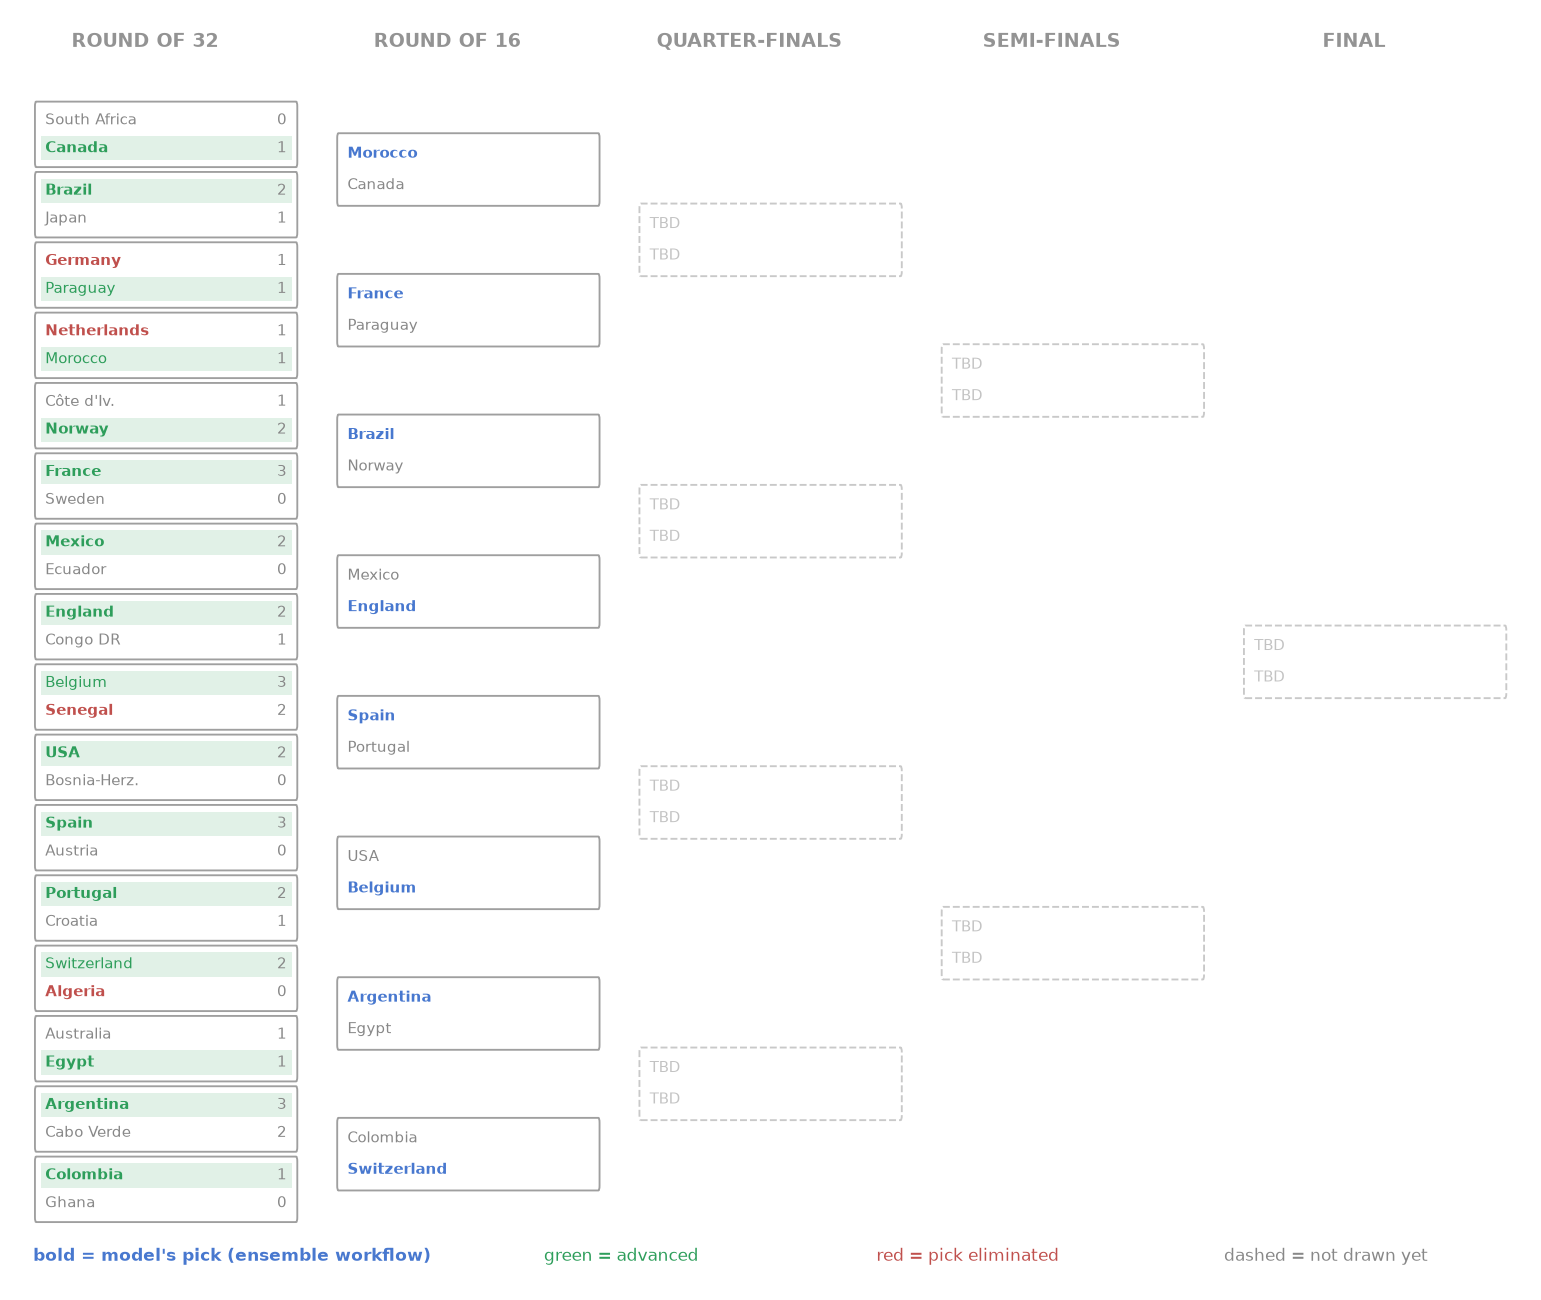
The whole tracker refreshes with three commands after each round:
node elo_scraper.js — re-scrape the match histories and ratings.quarto render — regenerate the site.The only file edited by hand between rounds is fixtures.py, where the next round’s matchups are added once they are known.